Production-Grade AI: Circuit Breakers, DLQs, and Full-Stack Observability
How to prevent cascading LLM outages, handle poison-pill payloads, and safeguard your cloud budget.
If your primary AI model provider experiences an unscheduled outage at 2:00 AM on a Friday, does your application trigger an automated multi-model failover, or does your on-call engineer get woken up by an avalanche of Sev-1 incident pages?
In Part 1 and Part 2 of this series, we explored why multi-agent systems must be designed as distributed architectures, and how Event-Driven Architecture (EDA) with Apache Kafka decouples your pipeline.
Today, in the final installment of our 3-part deep dive, we tackle production hardening. We examine how senior architects use aviation-grade resilience patterns—circuit breakers, randomized jitter, multi-provider fallbacks, and Dead-Letter Queues (DLQs)—alongside full-stack OpenTelemetry observability to run mission-critical AI workloads without fear.
During our conversation on the Out of the Box Developer Podcast, Denis shared how his team constructs enterprise containment bulkheads around generative agents. Let’s look at the implementation blueprints.
The Aviation Analogy: Engineering for Inevitable Failure
When software engineers first integrate language models, they often adopt a defensive coding mindset: they try to anticipate every possible malformed string or prompt failure. But in enterprise systems operating at scale, third-party model downtime is not an edge case—it is an inevitability.
Denis introduced a powerful perspective borrowed from aerospace engineering:
“When an engine is designed for aviation, it is not built to never fail. It is built so that when it fails—because there are limits to what you can prevent—we have redundancy. The other engine is enough to keep the airplane flying and find a safe place to land. That is resilience. Fault tolerance addresses specific errors like database latency or an unavailable API, whereas resilience is a broader discipline encompassing observability, telemetry, and graceful degradation. Think of bulkheads on ships: watertight compartments prevent a hull breach from flooding the entire ship and sinking it.”
If one of your agents fails to parse a document or hits an upstream HTTP 503, does your architectural bulkhead isolate the failure, or does it drag down the entire enterprise ship?
Hardening the Pipeline: Three Core Resilience Patterns
During his live demo using Quarkus and LangChain4j, Denis demonstrated how each AI agent microservice is wrapped inside declarative resilience policies. Here are the three non-negotiable patterns every production AI pipeline needs:
1. Bounded Retries with Exponential Backoff and Jitter
When an inference endpoint returns an HTTP 429 (Rate Limit) or transient 500 error, retrying is sensible. But if dozens of worker threads retry simultaneously on rigid 1,000ms intervals, they create a thundering herd that crushes the recovering gateway.
Denis added randomized jitter to distribute retries smoothly:
“For every event retrieved from the topic, we configure a retry policy with a maximum of three retries—meaning up to four attempts total—with an initial delay of one second and a variation of jitter delay. If you have many concurrent retries, the jitter prevents them from firing at the exact same millisecond.”
2. The Circuit Breaker and Multi-Model Fallback
What happens when OpenAI experiences a sustained ten-minute outage? Continuing to retry thousands of background events will saturate your thread pools and lock database connections.
A Circuit Breaker tracks failure rates over a rolling execution window. When failures exceed a defined threshold (e.g., 50% across four requests), the circuit trips open, immediately intercepting and rerouting requests without touching the dead dependency.
Even better, Denis showcased an automated multi-model fallback:
“In our circuit breaker, if half of the events in our window fail, the circuit opens and halts calls for a ten-second delay. That gives the downstream service a chance to recover and prevents cascading crashes. After ten seconds, it allows a single probe event through. Even better, we can configure a fallback! If GPT-4o is unavailable and the circuit trips open, the fallback can seamlessly route the event to Gemini to keep the pipeline moving without stopping the business.”
An architecture that automatically switches providers during a third-party outage transforms a potential Sev-1 outage into an invisible operational blip.
3. The Dead-Letter Queue (DLQ) with Human-in-the-Loop
Some payloads—whether due to corrupt UTF-8 text, toxic content tripping safety filters, or schema violations—will fail repeatedly regardless of retries.
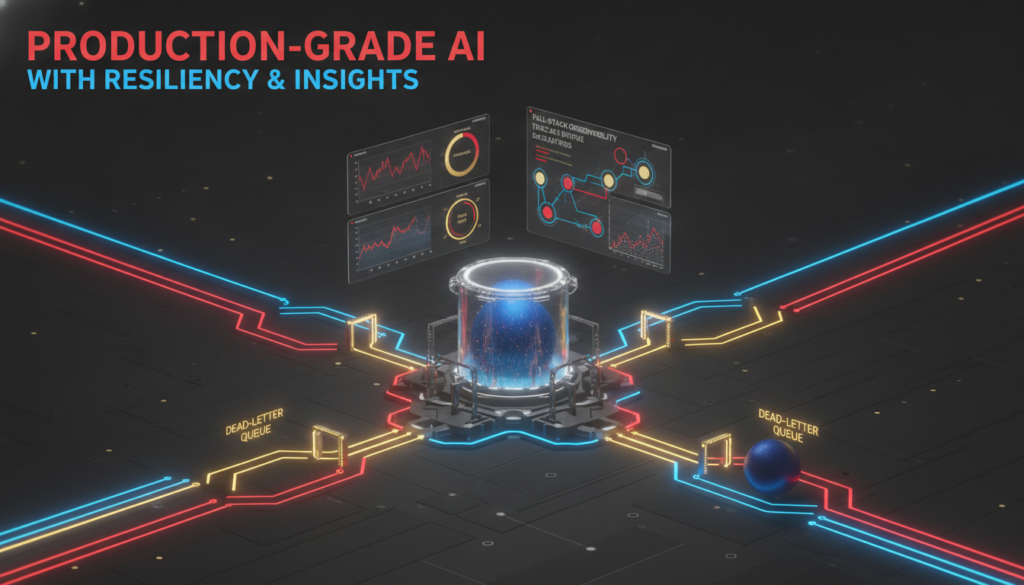
Instead of dropping these messages or blocking the Kafka topic, unprocessable events are routed to a Dead-Letter Queue (DLQ).
During our stream, we discussed the operational lifecycle of a DLQ:
Denis: “When an event reaches the maximum retry limit of three, it goes directly to the dead-letter queue. From there, we have observability configured to send an alert notification so we know an event failed.”
Pedro: “And then we can add another agent that reads the dead-letter queue from time to time to retry, or we can put a human to analyze what happened.”
Denis: “Right! An agent or a human to analyze what went wrong. Humans are definitely still very useful here!”
Routing failed events to a DLQ protects topic processing velocity for healthy users while ensuring zero data loss for manual inspection.
Full-Stack Observability: Distributed Traces and Token FinOps
You cannot manage what you cannot measure. In asynchronous, multi-agent architectures, traditional centralized logs are insufficient because events hop across disparate containers, Kafka topics, and external APIs.
To solve this, Denis integrated OpenTelemetry (OTel) to trace the entire lifecycle of an event through Grafana:
“A trace tracks everything that happens when processing a single piece of content. When an event reaches each agent event processor, we record a span inside it. A trace is composed of many spans. For example, when our content was first published, we saw that it took just a few microseconds to reach the first agent, Content Enrichment. Then GPT-4o took almost three seconds to process the request. After a few microseconds in the message queue, it reached the Sensitivity Agent, which took about one second to respond. By viewing the entire trace in Grafana, we can immediately see where every millisecond was spent.”
Just as crucially, Denis showcased a real-time Model FinOps dashboard that calculates dollar costs on the fly:
“This dashboard tracks our three AI agents. You can see the input token usage for each agent, the output token usage, and LangChain even generates estimated costs for each agent. You can track exactly how much money each agent is consuming. With Grafana and Prometheus, you can even configure alerts to notify your team before costs exceed your predefined budget.”
Key Architectural Takeaways
- Build containment bulkheads: Wrap all LLM and tool calls in circuit breakers with strict execution timeouts and automated multi-provider fallbacks.
- Never drop failed events: Route exhausted retry attempts to a dead-letter queue so human reviewers or diagnostic workers can audit errors without holding up the pipeline.
- Enforce real-time FinOps governance: Propagate OpenTelemetry trace headers across all queues and monitor token consumption per agent to detect runaway cost spikes before billing cycles close.
Listen to the full deep dive here.
How are you monitoring token costs and handling third-party model downtimes in production? Have you implemented circuit breakers or multi-model fallbacks yet? Let’s discuss in the comments below!
Cheers,
Pedro Cavalero
P.S. Thank you for following along with this 3-part series on building resilient multi-agent systems! If you enjoyed this breakdown, make sure to subscribe to the Out of the Box Developer Podcast and share this edition with your engineering team.